

Reporting is likely where most users spend the majority of their time -- trying to understand their data and figure out how to optimise.
Below I'll go over the reporting page and how to use it. Also, see our Quickstats and Campaigns Analysis article, as quite often these reports are faster and get you to the basic data you need.
You can also check the reporting help section for a number of other articles.
How reporting works
FunnelFlux Pro reporting is highly flexible and lets you group into a tree with very few limitations.
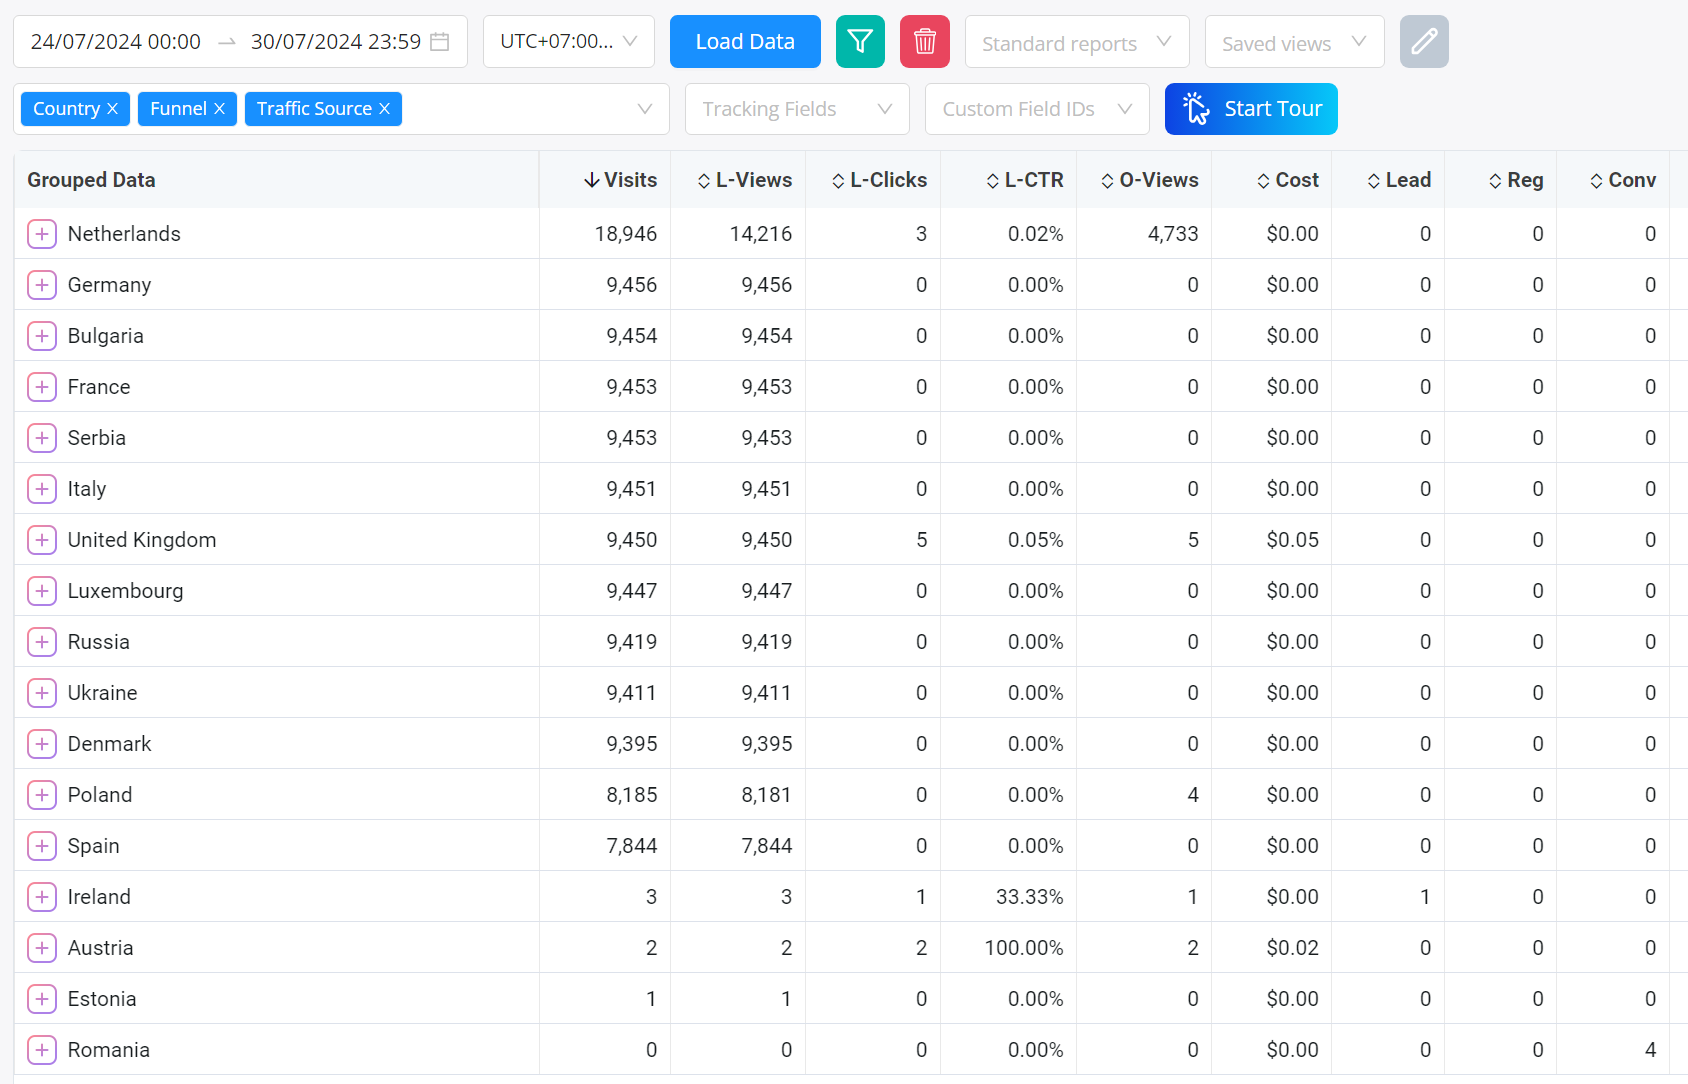
On the reporting page, you can choose your date/time range then add attributes in order that you'd like to group by:
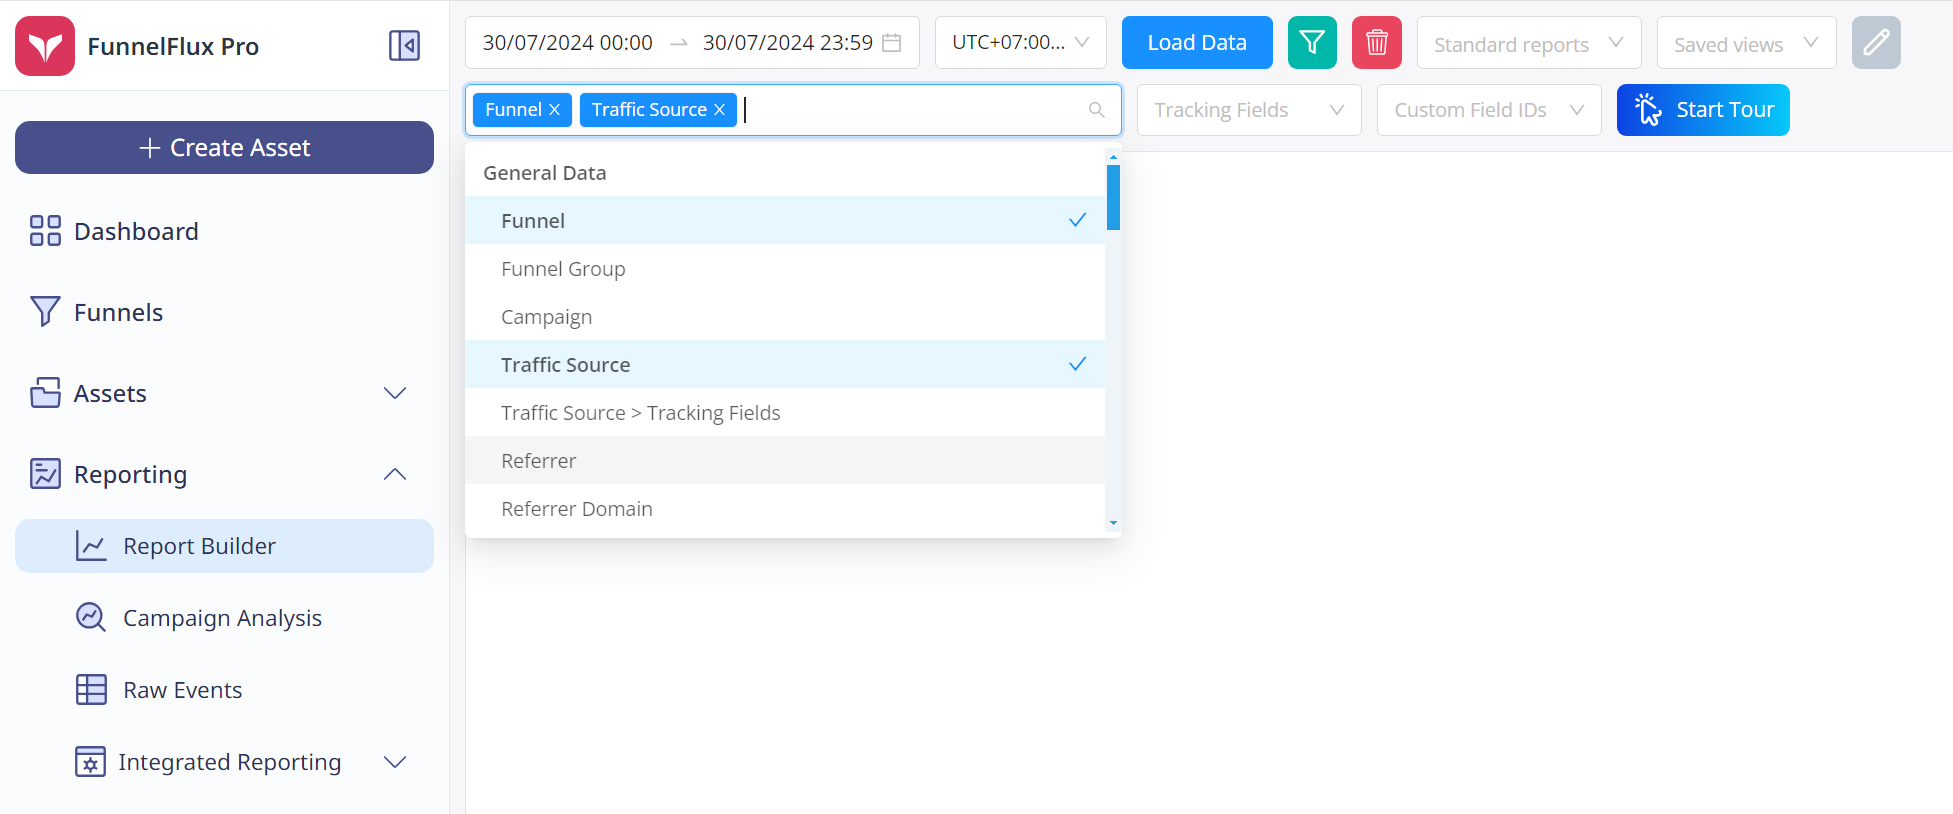
You can also load one of our "standard reports" for a specific preset:
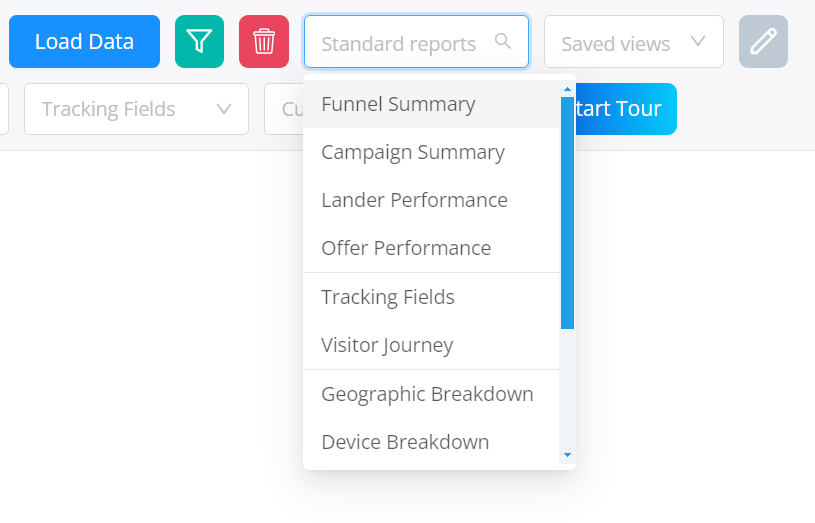
Then, click apply to load the report.
You can expand the tree as needed to drill down into the data.
All data will lazy-load as you expand. This is done so that data is loaded quickly in small parts, rather than trying to generate a huge single report.
The downside is that you can't export the full report to Excel/CSV directly, but we will provide a dedicated export function for this later.
Setting columns and displayed metrics
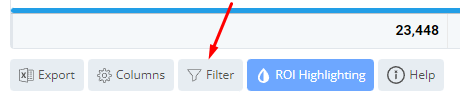
To set columns to display, click the columns icon in the footer (or you can tap the "S" hotkey):
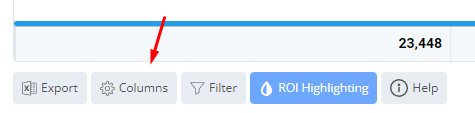
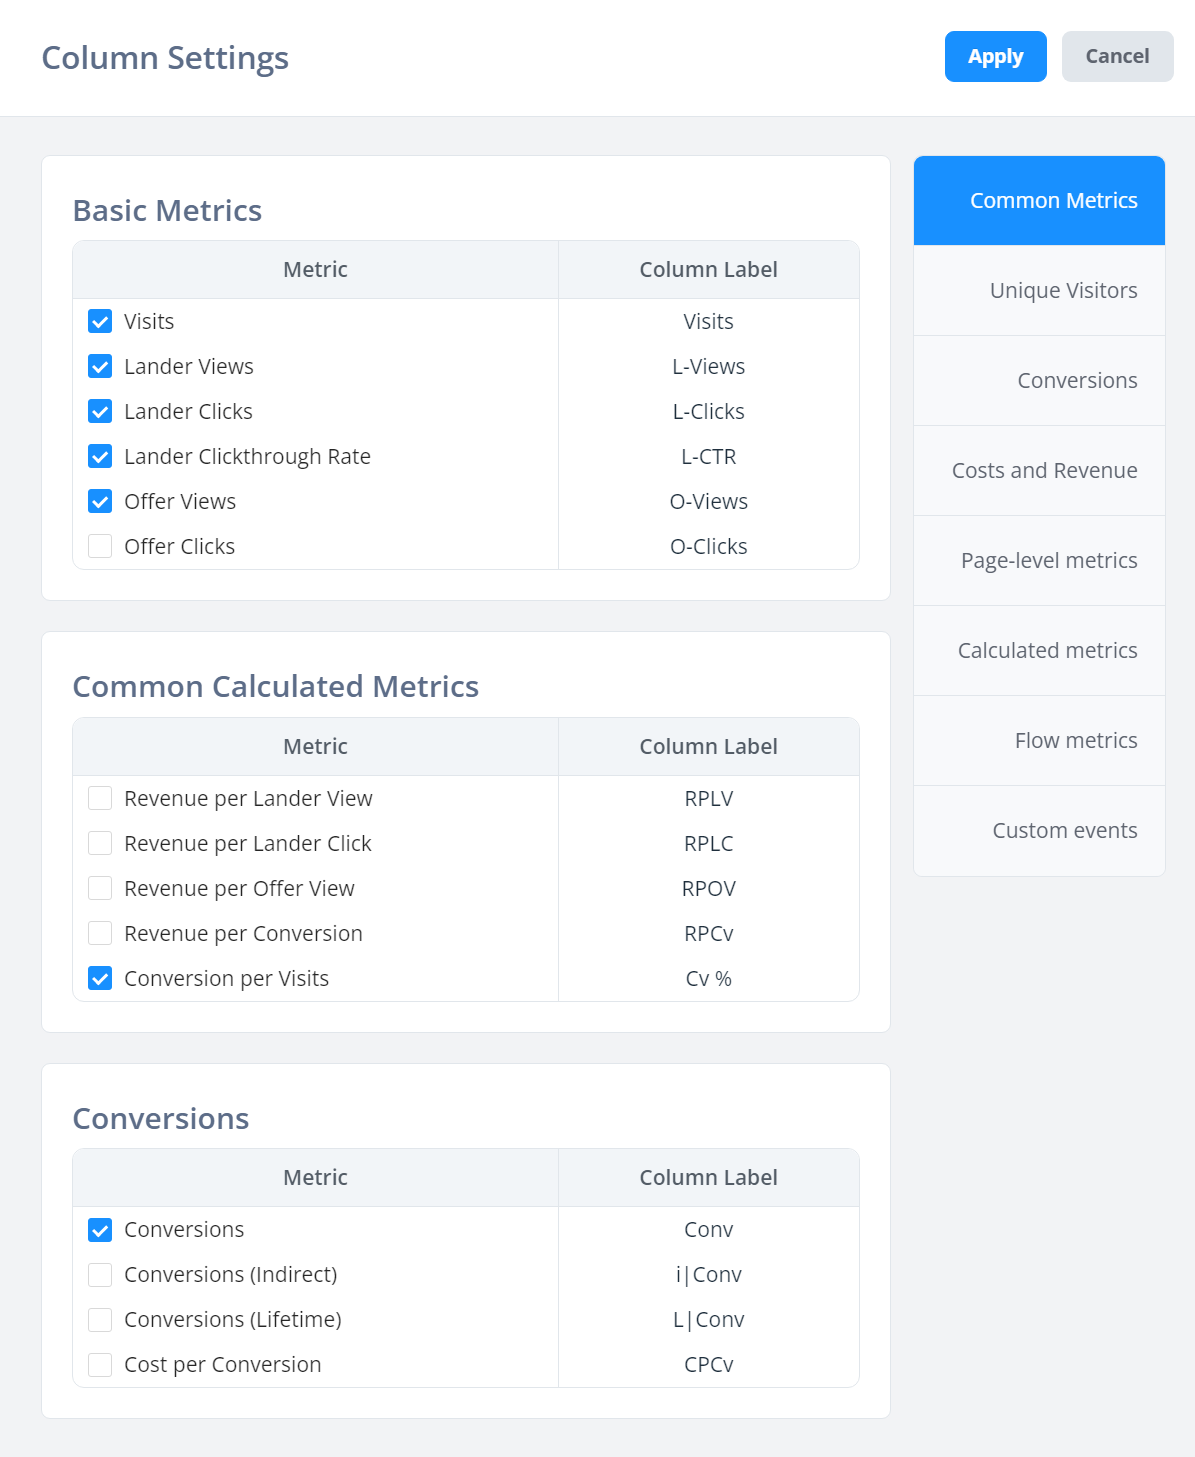
You can browse through the different tabs to find columns you would like to display.
You can drag the table's column headers to move them into a different order.
Note that the abbreviation for each metric is displayed beside it, e.g. Cost per Visitor | CPV -- in the table, we will display "CPV" as the column name, not "Cost per Visitor". This is done to keep the columns narrow, otherwise the table can become unnecessarily wide.
Also note that in FunnelFlux, landers and offers are two separate types of pages, each having their own view and click metrics.
As such, a lander row will always show zeroes in the offer view/clicks columns and vice versa. If you have a funnel with your own offer pages in it (as opposed to a typical affiliate funnel where the end page is an offer you don't control), then you may need to look at offer view, click and CTR columns.
Filtering options
You can filter in two ways -- using inline filters or the restrict data option.
Inline filters can be turned on in the footer, or with the "F" hotkey:
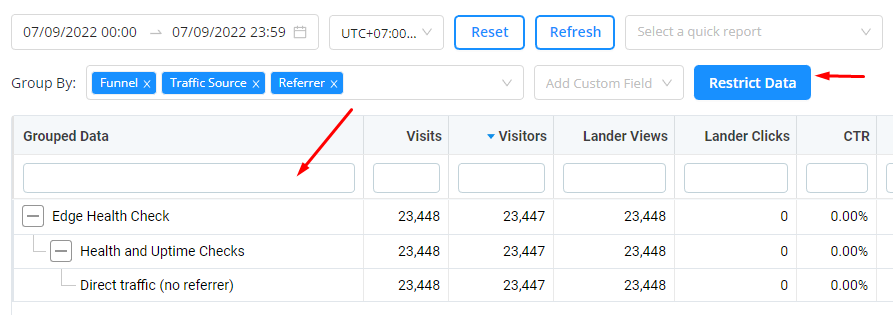
Inline filtering works as-you-type and you can enter data in multiple columns.
The inline filtering always acts on the deepest child, so in the above example if I write "dire.." it will be filtering on the "Direct traffic (no referrer)" row, not on the parent rows. Sometimes you'd want to filter on a different row, but we have to pick one default option here for now -- and we have chosen the "deepest row" option.
For number columns, you can use operators e.g. >1000, <1000, 1000-25000.
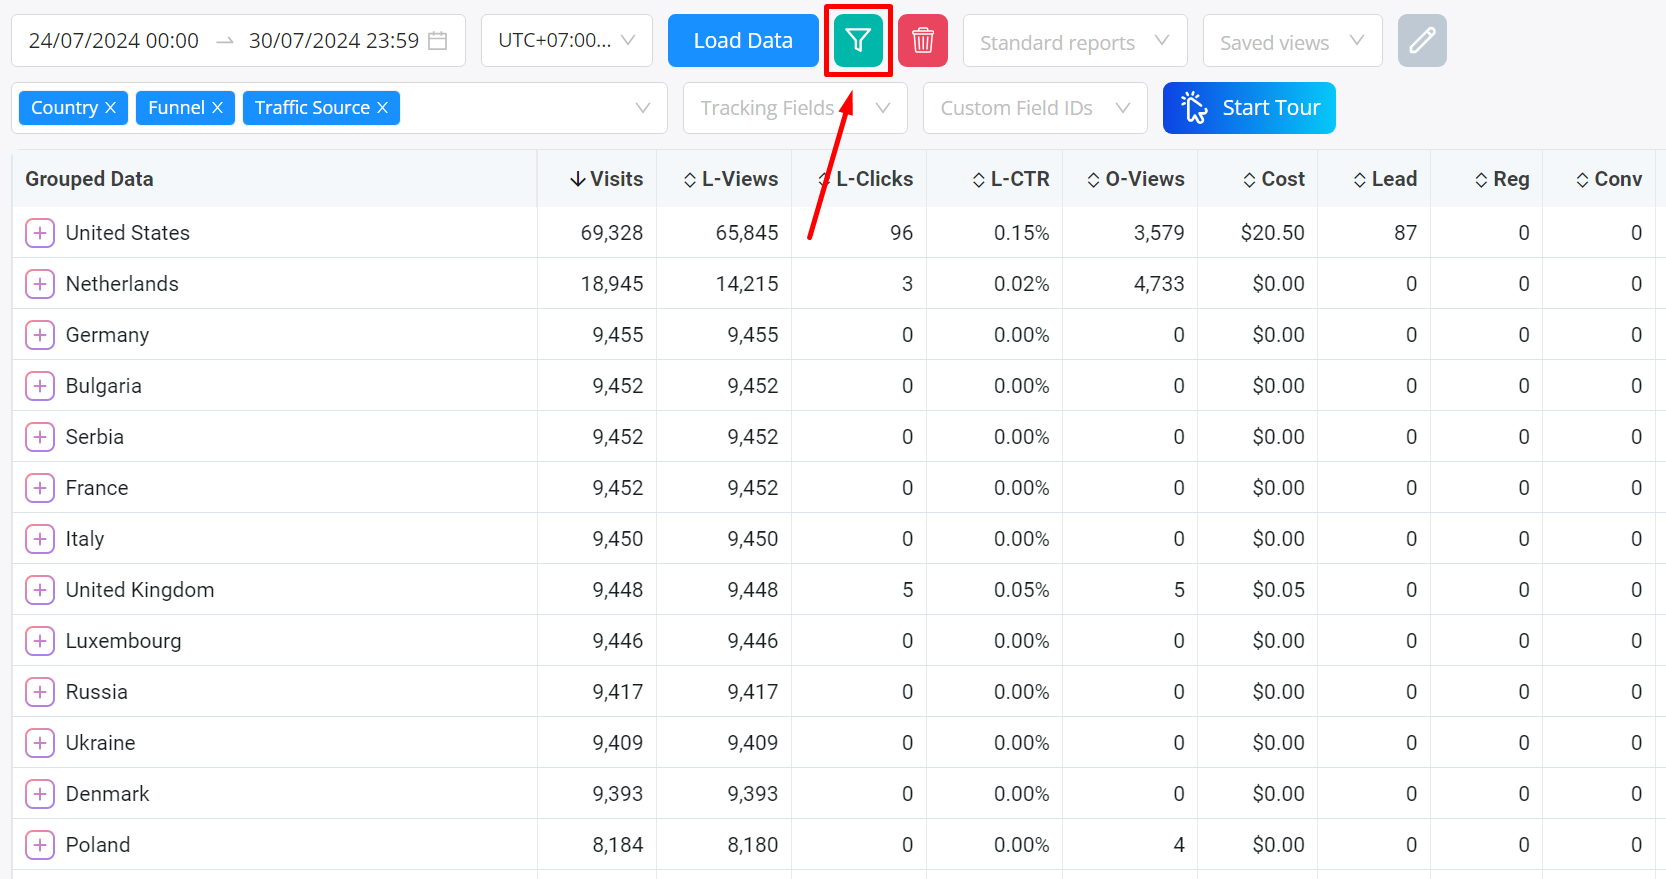
On the other hand, the Data Filtering option allows you to filter the entire report query to include or exclude certain attribute values:
Here for example, I can decide to filter to only the continent Europe, even though continent is not in my groupings:
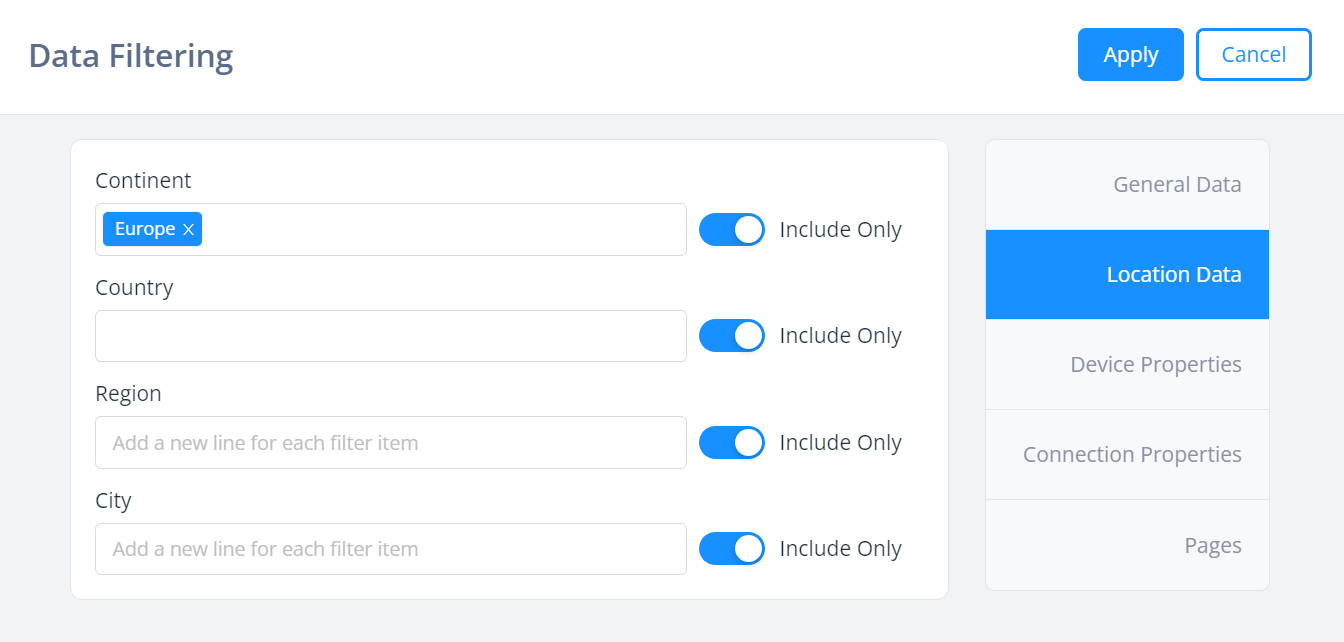
Now on clicking apply, it will then reload the report, giving:
Notice how the United States row has now disappeared, as the entire report is only showing data from continent = europe.
How journey attributes work
The "Journey" reports are unique to FunnelFlux and are necessary to display complex funnel data in a table format.
Firstly, for basic reporting, you might find the visual heatmaps in funnels either -- so be sure to check there.
Now, in FunnelFlux, unlike most trackers, there is no prescribed sequence of pages.
In many trackers there are a few specific sequences only:
- Traffic > offer
- Traffic > lander > offer
- Traffic > prelander > lander > offer
There is no such requirement in FunnelFlux. Your funnel can do any sequence, users can start anywhere. There is no requirement for a lander or offer to exist before or after anything in particular.
For example, your user might go Traffic > offer > lander > offer > lander > lander
Because of this, we cannot provide a "Lander + offer" attribute. It is simply non-sensical.
It would be like asking people on the street what their "single lunch food item + single drink item is", requiring them to have eaten the food first, then a drink, only one of each, and in that exact sequence.
Instead, we offer the Journey attributes, with a few variations that remove certain node types to make the tree simpler.
Note: if you try to group lander and offer attributes together, we will automatically collapse these into Journey.
These are available as three attributes - full, groups and pages only:
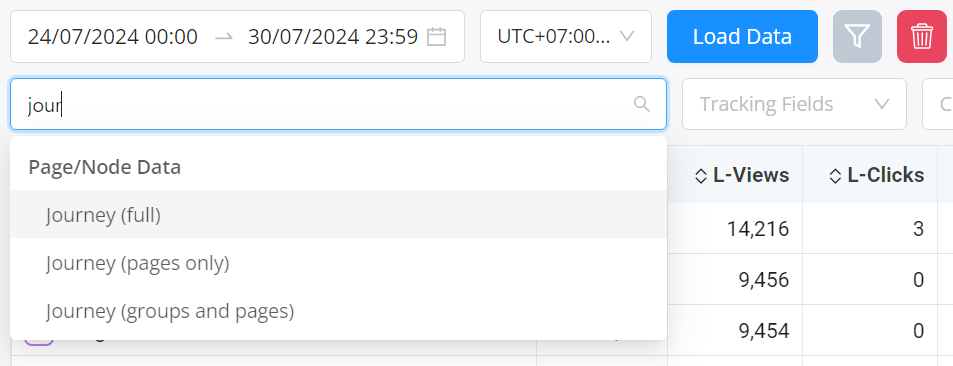
They are all actually doing a full report, but with post-filtering to remove nodes like rotators if desired.
Use this journey reporting to understand the sequence users go through and the visits, revenue per view, etc. at each level.
Make sure to always group by funnel first, else the data may not make sense.
Example:
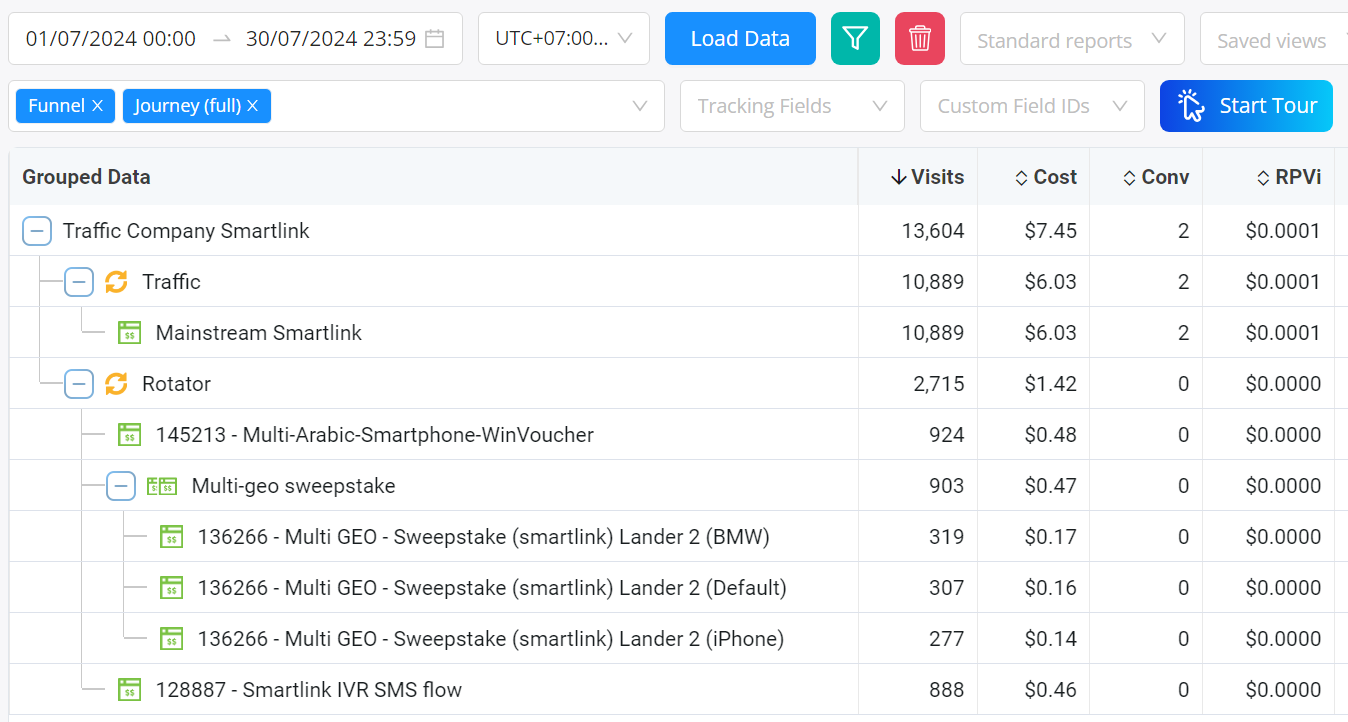
Here you can see how traffic went to two starting points -- the traffic node and some other rotator. From there it went to a mainstream smartlink offer, and from the other rotator it went to three offer groups. One of those groups then had three offer pages inside of it.
Note that when a group only has one page in the journey tree, we collapse it down into one line - but in the case of multiple, it becomes a tree like above for the Multi-geo sweepstake.
In Journey reports, RPVi (revenue per visit) is probably your most valuable metric for understanding the money per visit to that node/level.
Otherwise the revenue per offer view (RPOV) will show you the earnings per offer view, indicating performance of the offer directly.
In the future, we will add some other columns like flow % (how many people got to this level versus parent) and RPV relative to parents as well, for even deeper analysis.
Breaking down by URL data (e.g. keywords)
A common question is, "how do I see keyword data".
All data like this that comes from traffic sources is passed via URL parameters, as defined in your traffic source config in FunnelFlux.
To group by these there are two methods. Firstly, you can add a specific URL field from a specific source here, or add it by numbered column ID (you can see these c1, c2 IDs in your traffic source config):
Note when you do this it will limit all further choices to that source only in the dropdown.
This is because its non-sensical to group by URL parameter 1 of traffic source A, then URL parameter 2 of traffic source B. Users cannot be from two traffic sources simultaneously, so such a grouping would never work.
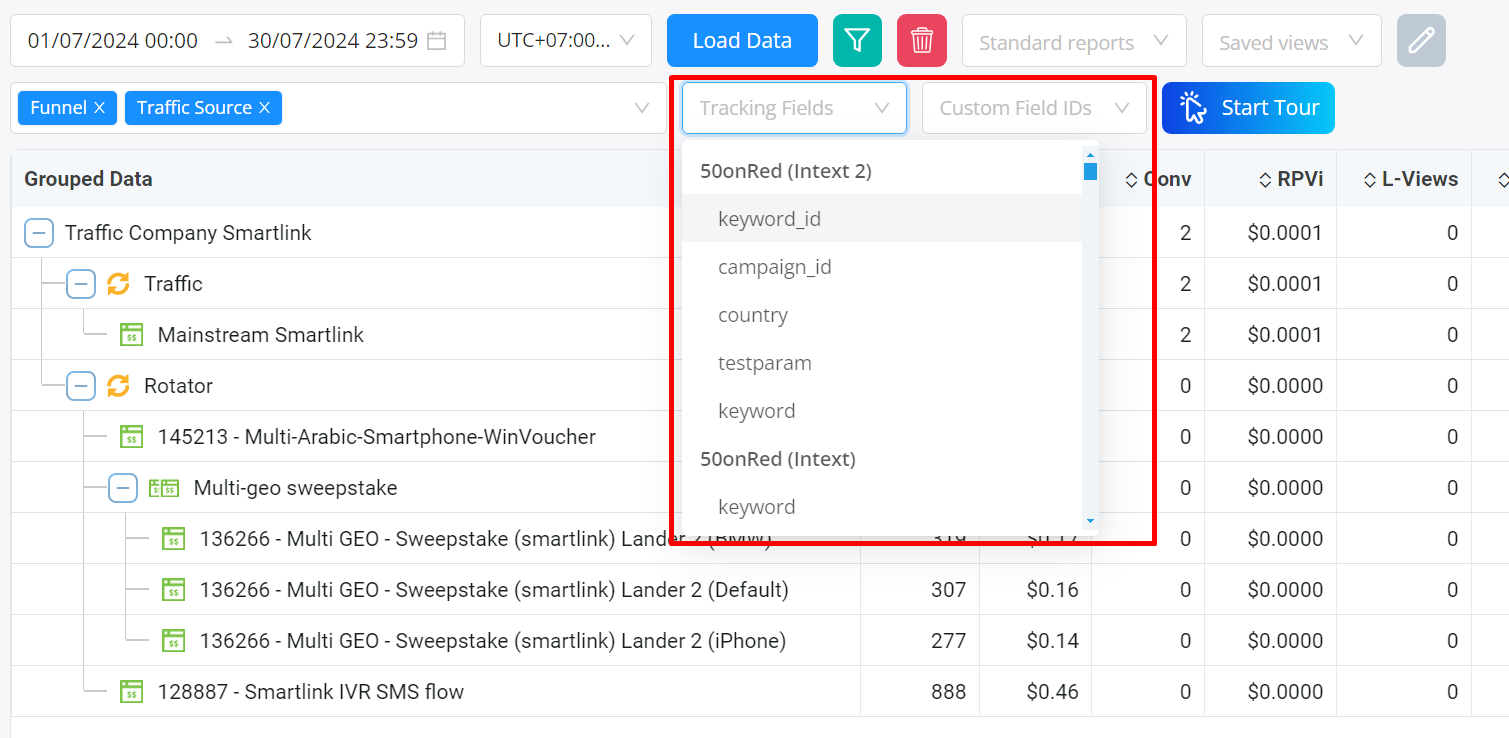
Alternatively, and this is usually much easier, user the Traffic Source > Tracking Fields attribute:
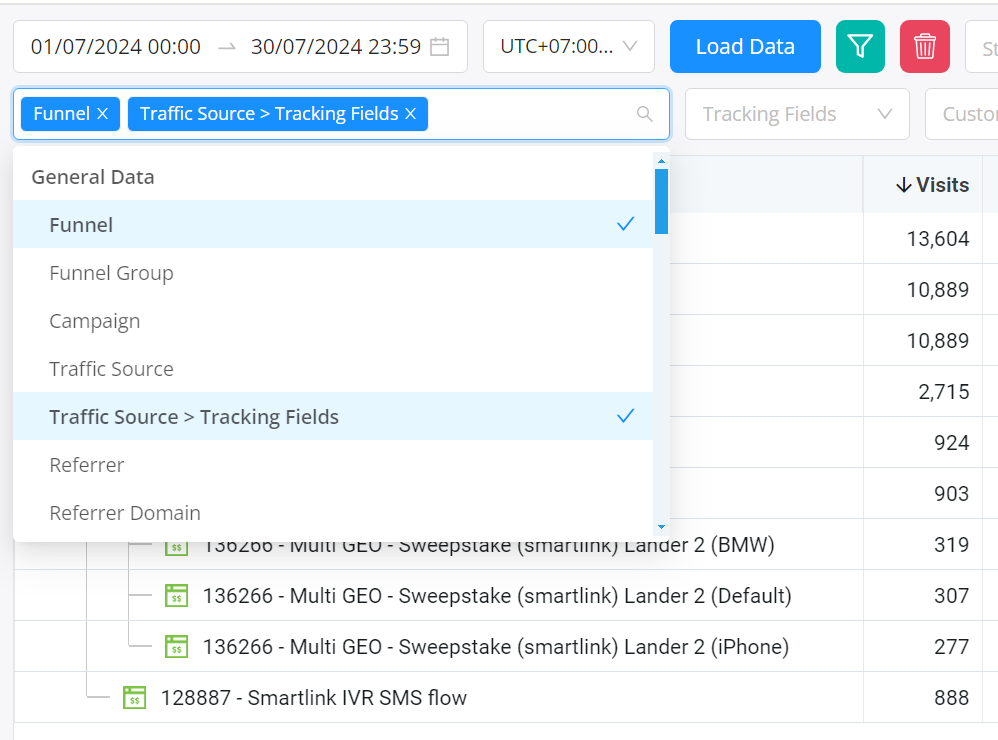
This is a compound attribute that groups by traffic source then all tracking fields, showing their names and IDs. This makes it much easier to break down multiple traffic sources and their fields together.
Lastly, you may also want to consider using quick stats to drill into the specific traffic source on its own, or the campaign analysis page.
On the campaign analysis page you can open a reporting overlay for a specific traffic source campaign and click buttons to switch between tracking field breakdowns.
This will often be much faster than manually building reports every time. Learn to leverage quickstats, they are usually... quick!